berniezh
New Member
Hallo zusammen
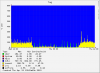
seit ca. 1 Woche ist mein Server ziemlich langsam. Die IO wait Zahlen gehen bis weit über 50%. Irgendwie vermute ich MySql dahinter. Habe diverse Optimierungsmassnahmen durchgespielt. Ohne Erfolg.
tuning-primer.sh zeigt:
top zeigt:
Server:
Prozessor: Pentium4 FSB800 3.0GHz
Speicher: 4096MB DDR PC3200
Festplatte: 160GB RAID1 SATA
Betriebssystem: SuSE Linux 10.1
Zusatzsoftware: Confixx 3.0
iostat zeigt:
mysqlreport zeigt:
Vielen Dank für Hilfe!
Gruss
Bernie
seit ca. 1 Woche ist mein Server ziemlich langsam. Die IO wait Zahlen gehen bis weit über 50%. Irgendwie vermute ich MySql dahinter. Habe diverse Optimierungsmassnahmen durchgespielt. Ohne Erfolg.
tuning-primer.sh zeigt:
Code:
MySQL Version 5.0.51-log i686

Uptime = 0 days 0 hrs 36 min 13 sec
Avg. qps = 99
Total Questions = 216933
Threads Connected = 96

Warning: Server has not been running for at least 48hrs.
It may not be safe to use these recommendations

To find out more information on how each of these
runtime variables effects performance visit:
http://dev.mysql.com/doc/refman/5.0/en/server-system-variables.html

SLOW QUERIES
Current long_query_time = 10 sec.
You have 0 out of 216983 that take longer than 10 sec. to complete
The slow query log is enabled.
Your long_query_time may be too high, I typically set this under 5 sec.

WORKER THREADS
Current thread_cache_size = 512
Current threads_cached = 15
Current threads_per_sec = 0
Historic threads_per_sec = 0
Your thread_cache_size is fine

MAX CONNECTIONS
Current max_connections = 500
Current threads_connected = 96
Historic max_used_connections = 111
The number of used connections is 22% of the configured maximum.
Your max_connections variable seems to be fine.

MEMORY USAGE
Max Memory Ever Allocated : 1 G
Configured Max Per-thread Buffers : 1 G
Configured Max Global Buffers : 675 M
Configured Max Memory Limit : 2 G
Total System Memory : 4.58 G
Max memory limit seem to be within acceptable norms

KEY BUFFER
Current MyISAM index space = 100 M
Current key_buffer_size = 47 M
Key cache miss rate is 1 : 1064
Key buffer fill ratio = 11.00 %
Your key_buffer_size seems to be too high.
Perhaps you can use these resources elsewhere

QUERY CACHE
Query cache is enabled
Current query_cache_size = 100 M
Current query_cache_used = 98 M
Current query_cach_limit = 1 M
Current Query cache fill ratio = 98.22 %
However, 17598 queries have been removed from the query cache due to lack of memory
Perhaps you should raise query_cache_size
MySQL won't cache query results that are larger than query_cache_limit in size

SORT OPERATIONS
Current sort_buffer_size = 160 K
Current record/read_rnd_buffer_size = 252 K
Sort buffer seems to be fine

JOINS
Current join_buffer_size = 3.00 M
You have had 758 queries where a join could not use an index properly
You have had 72 joins without keys that check for key usage after each row
You should enable "log-queries-not-using-indexes"
Then look for non indexed joins in the slow query log.
If you are unable to optimize your queries you may want to increase your
join_buffer_size to accommodate larger joins in one pass.

Note! This script will still suggest raising the join_buffer_size when
ANY joins not using indexes are found.

OPEN FILES LIMIT
Current open_files_limit = 65535 files
The open_files_limit should typically be set to at least 2x-3x
that of table_cache if you have heavy MyISAM usage.
Your open_files_limit value seems to be fine

TABLE CACHE
Current table_cache value = 40000 tables
You have a total of 6327 tables
You have 6382 open tables.
The table_cache value seems to be fine

TEMP TABLES
Current max_heap_table_size = 1.00 G
Current tmp_table_size = 2.00 G
Of 3567 temp tables, 19% were created on disk
Effective in-memory tmp_table_size is limited to max_heap_table_size.
Created disk tmp tables ratio seems fine

TABLE SCANS
Current read_buffer_size = 156 K
Current table scan ratio = 305 : 1
read_buffer_size seems to be fine

TABLE LOCKING
Current Lock Wait ratio = 1 : 9087
Your table locking seems to be fine
top zeigt:
Code:
top - 12:49:24 up 4 days, 53 min,  1 user,  load average: 3.37, 2.99, 3.57
Mem:   3765832k total,  3445784k used,   320048k free,   260760k buffers
Swap:  1045480k total,        0k used,  1045480k free,  2047948k cached
Mem:   3765832k total,  3446528k used,   319304k free,   260756k buffers
  PID USER      PR  NI  VIRT  RES  SHR S %CPU %MEM    TIME+  COMMAND
24454 wwwrun    18   0 99.0m  43m  14m R   42  1.2   0:08.98 httpd2-prefork
21352 web6p1    17   0 49464  45m 2456 D   11  1.2   2:48.56 spamd
23527 wwwrun    15   0 82100  26m  16m S    8  0.7   0:23.07 httpd2-prefork
22798 wwwrun    15   0 80916  24m  15m S    7  0.7   0:10.19 httpd2-prefork
22536 mysql     18   0  832m 259m 5856 S    4  7.1   1:36.69 mysqld
24659 root      16   0  2308 1204  848 R    1  0.0   0:01.68 top
25183 postfix   15   0  6724 3584 2844 S    1  0.1   0:00.08 smtpd
    1 root      15   0   724  284  248 S    0  0.0   0:01.81 init
    2 root      RT   0     0    0    0 S    0  0.0   0:00.00 migration/0
    3 root      34  19     0    0    0 S    0  0.0   0:00.08 ksoftirqd/0
    4 root      RT   0     0    0    0 S    0  0.0   0:00.00 migration/1
    5 root      34  19     0    0    0 S    0  0.0   0:00.52 ksoftirqd/1
    6 root      10  -5     0    0    0 S    0  0.0   0:00.00 events/0
    7 root      10  -5     0    0    0 S    0  0.0   0:00.00 events/1
    8 root      19  -5     0    0    0 S    0  0.0   0:00.00 khelper
    9 root      10  -5     0    0    0 S    0  0.0   0:00.00 kthread
   13 root      10  -5     0    0    0 S    0  0.0   0:02.64 kblockd/0
   14 root      10  -5     0    0    0 S    0  0.0   0:00.34 kblockd/1
   15 root      17  -5     0    0    0 S    0  0.0   0:00.00 kacpid
   93 root      16  -5     0    0    0 S    0  0.0   0:00.00 cqueue/0
   94 root      16  -5     0    0    0 S    0  0.0   0:00.00 cqueue/1
   95 root      10  -5     0    0    0 S    0  0.0   0:00.00 kseriod
  135 root      17  -5     0    0    0 S    0  0.0   2:54.46 kswapd0
  136 root      18  -5     0    0    0 S    0  0.0   0:00.00 aio/0
  137 root      19  -5     0    0    0 S    0  0.0   0:00.00 aio/1
  379 root      16  -5     0    0    0 S    0  0.0   0:00.00 kpsmoused
  717 root      16  -5     0    0    0 S    0  0.0   0:00.00 ata/0
  718 root      16  -5     0    0    0 S    0  0.0   0:00.00 events/1
    8 root      19  -5     0    0    0 S    0  0.0   0:00.00 khelper
    9 root      10  -5     0    0    0 S    0  0.0   0:00.00 kthread
   13 root      10  -5     0    0    0 S    0  0.0   0:02.64 kblockd/0
   14 root      10  -5     0    0    0 S    0  0.0   0:00.34 kblockd/1
   15 root      17  -5     0    0    0 S    0  0.0   0:00.00 kacpid
Server:
Prozessor: Pentium4 FSB800 3.0GHz
Speicher: 4096MB DDR PC3200
Festplatte: 160GB RAID1 SATA
Betriebssystem: SuSE Linux 10.1
Zusatzsoftware: Confixx 3.0
iostat zeigt:
Code:
avg-cpu:  %user   %nice %system %iowait  %steal   %idle
          17.24    0.06    3.70   32.61    0.00   46.38

Device:            tps   Blk_read/s   Blk_wrtn/s   Blk_read   Blk_wrtn
sda             109.45       853.57      1767.55  297899546  616882728
mysqlreport zeigt:
Code:
MySQL 5.0.51-log         uptime 0 0:34:18       Thu Feb 28 12:53:47 2008

__ Key _________________________________________________________________
Buffer used     4.75M of  48.00M  %Used:   9.90
  Current      10.16M            %Usage:  21.17
Write hit      20.90%
Read hit       99.90%

__ Questions ___________________________________________________________
Total         202.99k    98.6/s
  QC Hits     119.90k    58.3/s  %Total:  59.07
  DMS          75.71k    36.8/s           37.30
  Com_          8.47k     4.1/s            4.18
  -Unknown      2.06k     1.0/s            1.01
  COM_QUIT        965     0.5/s            0.48
Slow (10)           0       0/s            0.00  %DMS:   0.00  Log:  ON
DMS            75.71k    36.8/s           37.30
  SELECT       61.00k    29.6/s           30.05         80.57
  DELETE        8.24k     4.0/s            4.06         10.88
  INSERT        4.07k     2.0/s            2.00          5.37
  UPDATE        2.40k     1.2/s            1.18          3.17
  REPLACE           0       0/s            0.00          0.00
Com_            8.47k     4.1/s            4.18
  change_db     5.92k     2.9/s            2.91
  admin_comma   2.06k     1.0/s            1.02
  show_fields     182     0.1/s            0.09

__ SELECT and Sort _____________________________________________________
Scan            8.32k     4.0/s %SELECT:  13.64
Range           1.31k     0.6/s            2.15
Full join         717     0.3/s            1.18
Range check        62     0.0/s            0.10
Full rng join       0       0/s            0.00
Sort scan       3.08k     1.5/s
Sort range      7.52k     3.7/s
Sort mrg pass       7     0.0/s

__ Query Cache _________________________________________________________
Memory usage   98.84M of 100.00M  %Used:  98.84
Block Fragmnt   0.52%
Hits          119.90k    58.3/s
Inserts        55.35k    26.9/s
Insrt:Prune    3.31:1    18.8/s
Hit:Insert     2.17:1

__ Table Locks _________________________________________________________
Waited             11     0.0/s  %Total:   0.01
Immediate      95.14k    46.2/s

__ Tables ______________________________________________________________
Open              964 of 4000    %Cache:   2.41
Opened            970     0.5/s

__ Connections _________________________________________________________
Max used          111 of  500      %Max:  22.20
Total           1.84k     0.9/s

__ Created Temp ________________________________________________________
Disk table        606     0.3/s
Table           3.31k     1.6/s    Size:   2.0G
File               19     0.0/s

__ Threads _____________________________________________________________
Running             3 of   98
Cached             13 of  512      %Hit:  93.95
Created           111     0.1/s
Slow                0       0/s

__ Aborted _____________________________________________________________
Clients         1.74k     0.8/s
Connects            0       0/s

__ Bytes _______________________________________________________________
Sent          450.55M  218.9k/s
Received       63.55M   30.9k/s

__ InnoDB Buffer Pool __________________________________________________
Usage          70.52M of 512.00M  %Used:  13.77
Read hit       95.74%
Pages
  Free         28.25k            %Total:  86.23
  Data          4.50k                     13.74 %Drty:   0.73
  Misc             11                      0.03
  Latched           6                      0.02
Reads          90.46k    44.0/s
  From file     3.85k     1.9/s            4.26
  Ahead Rnd         1     0.0/s
  Ahead Sql         0       0/s
Writes         12.41k     6.0/s
Flushes         2.83k     1.4/s
Wait Free           0       0/s

__ InnoDB Lock _________________________________________________________
Waits               0       0/s
Current             0
Time acquiring
  Total             0 ms
  Average           0 ms
  Max               0 ms

__ InnoDB Data, Pages, Rows ____________________________________________
Data
  Reads         4.06k     2.0/s
  Writes        3.58k     1.7/s
  fsync         1.15k     0.6/s
  Pending
    Reads           0
    Writes          1
    fsync           0

Pages
  Created         532     0.3/s
  Read          3.97k     1.9/s
  Written       2.84k     1.4/s

Rows
  Deleted         436     0.2/s
  Inserted        742     0.4/s
  Read         15.27k     7.4/s
  Updated         112     0.1/s
Vielen Dank für Hilfe!
Gruss
Bernie